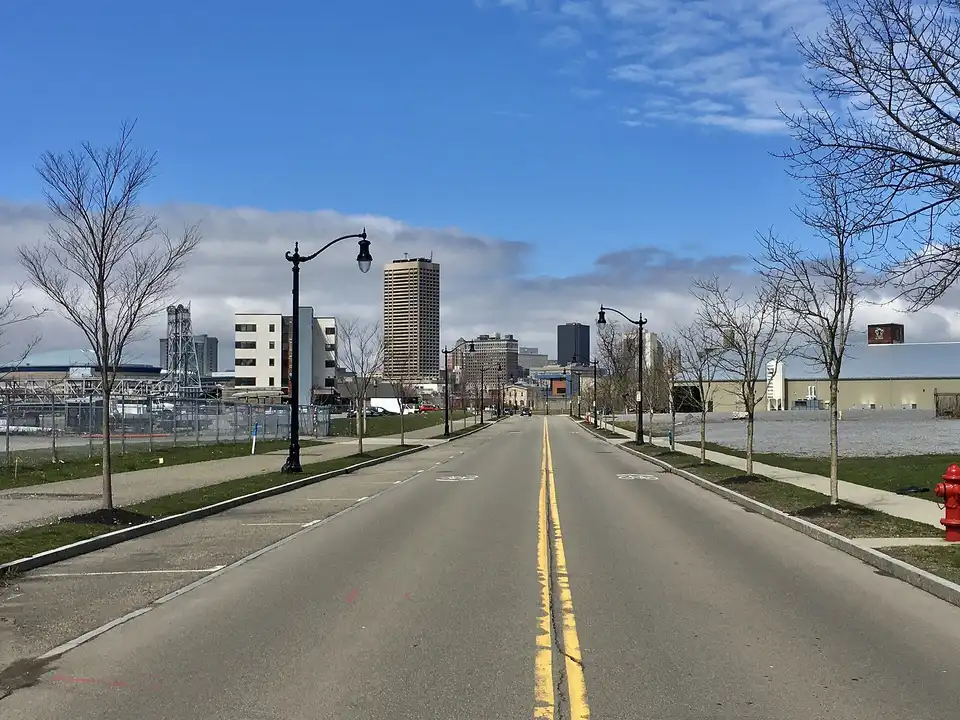
Living in Buffalo, NY
Buffalo is the 83rd-largest city in the US, home to about 275,000 people in 2025. Its population has been roughly flat since 2020. Prices across the metro area run below the national average (95.8 on an index where the US is 100).
- Population, 2025
- 274,613-1.3% since 2020
- Median home value
- $164,2003.3 years of median income
- Median rent
- $1,046/morent plus utilities
- Household income
- $50,041median, per year
- Price level
- 95.8US average = 100
- January / July highs
- 32° / 80°lows 19° / 63°
- Average commute
- 20 min11% work from home
- State income tax
- 10.9%top rate, graduated
Been to Buffalo?
Added to your city passport. See things to do
County: Erie County
Time zone: Eastern Time (UTC-5, UTC-4 in summer)
Elevation: about 600 ft
Metro area: Buffalo-Cheektowaga, NY
Cost of living in Buffalo
The median home in Buffalo is worth $164,200 and the median household earns $50,041 a year, so a typical home costs about 3.3 years of income. Median gross rent (rent plus utilities) is $1,046 a month, about 25% of the median household's income. BEA puts overall prices in the Buffalo-Cheektowaga, NY metro area at 95.8, with housing at 81.0 and goods at 99.7 (US = 100). In practice, a $75,000 salary in an average-priced place stretches about as far as $71,900 here. New York taxes wages at a top rate of 10.9%. The average combined state and local sales tax in New York is 8.54%.
What would my salary be worth in Buffalo?
Buffalo weather
Average highs run from 32°F in January to 80°F in July, and January nights average 19°F. It gets 41 inches of rain and melted snow a year and 95 inches of snow. Nights drop below freezing about 124 times a year. The most comfortable months are May to September.
Month-by-month weather and the best time to visit Buffalo
People and work
The median resident is 34.3 years old, and 31% of adults 25 and older hold a bachelor's degree or higher. 43% of households own their home. The average one-way commute is 20 minutes; 11% of workers work from home and 8% take public transit.
- Median age
- 34.3142nd youngest of 546
- Bachelor's or higher
- 31%adults 25+
- Homeowners
- 43%of households
- People per sq mile
- 6,80140.4 sq mi of land
- Take transit to work
- 8%5% walk, 0.7% bike
- Unemployment
- 7.3%2020-2024 average
- Poverty rate
- 26%of residents
- Typical home built
- 1938median year
Who moves to Buffalo, and where people go
From farther away, newcomers most often come from New York (Queens County), Kings County, NY and Bronx County, NY. People who leave for somewhere more than 100 miles away most often head to Charlotte (Mecklenburg County), New York (Queens County) and Kings County, NY. See the map and full lists
IRS county-to-county migration, 2022 to 2023 tax years. Where Americans are moving.
Natural hazards, home prices and air quality
Natural hazard risk
Relatively High
FEMA rating for Erie County, scored against every US county. Biggest risks: winter weather, cold wave, tornado, inland flooding.
Home prices
+4.4% in a year
Up 51% over five years. FHFA house price index for the Buffalo-Cheektowaga, NY area, 2026 Q2.
Air quality, 2025
64% good days
11 days unhealthy at least for sensitive groups. EPA daily air quality index for the Buffalo-Cheektowaga-Niagara Falls, NY area (365 days measured).
FEMA National Risk Index (December 2025) combines expected losses from 18 natural hazards with how vulnerable and resilient the community is. It describes the county, not your street; check flood maps for a specific address at FEMA's Flood Map Service Center.
Pros and cons of living in Buffalo
Data points come from the official sources on this page. Points marked Local come from people who live here, are read by a person before they appear, and are ranked by readers.
Pros
- Data Homes are affordable for locals: the median home costs 3.3 years of median household income, lower than in three quarters of the cities we cover.
- Data Commutes are short: 20 minutes each way on average.
Cons
- Data New York's top income tax rate is 10.9%, among the highest in the country.
- Data Winters are snowy: about 95 inches a year.
- Data Poverty is high: 26% of residents live below the poverty line.
Buffalo report card from locals
0 of 5 reports so far. We show the Buffalo report card once 5 residents have rated it, so one opinion never stands in for a whole city. Live here? Add yours.
Rate Buffalo (2 minutes)
Lived here once? Map every city you have lived in and see how your homes compare.
Ask a local about Buffalo
No questions yet. Thinking about a move? Ask about neighborhoods, schools, winters, traffic or anything else, and people who live in Buffalo can answer.
Buffalo through locals' eyes
No resident photos yet. Share the view from your street, your favorite park or the city on a good day.
Share a photo
Contributions are read by a person before they appear. We remove ads, links, personal attacks and anything about private people. See the most helpful locals.
Cities near Buffalo
| City | Distance | Population | Home value | Price level | |
|---|---|---|---|---|---|
| Rochester, NY | 65 mi | 206,108 | $139,600 | 97.0 | Compare |
| Erie, PA | 81 mi | 91,838 | $115,200 | 91.0 | Compare |
| Ithaca, NY | 125 mi | 33,632 | $342,700 | 103.3 | Compare |
| Syracuse, NY | 138 mi | 144,896 | $138,400 | 95.7 | Compare |
| Cleveland, OH | 173 mi | 363,608 | $102,000 | 93.9 | Compare |
| Pittsburgh, PA | 180 mi | 307,632 | $205,800 | 94.7 | Compare |
Straight-line distance between city centers.
Looking at the suburbs? Eggertsville, Kenmore and West Seneca lead our ranking of the best suburbs of Buffalo.
Cities with a similar profile
Closest match on climate, price level, size, income and median age, outside the immediate area.
Compare Buffalo with another city
Frequently asked questions
Is Buffalo a good place to live?
It depends on what you need. The numbers show prices below the national average, homes that cost under four years of median income, short commutes; the trade-offs are heavy snow. Compare Buffalo side by side with another city to see how it stacks up for you.
What is the population of Buffalo?
The Census Bureau estimates Buffalo had 274,613 residents on July 1, 2025, compared with 278,301 in April 2020 (-1.3%).
How much do you need to earn to live in Buffalo?
Using BEA price levels, a $75,000 salary in an average-priced US city buys about the same as $71,900 in the Buffalo area. The median household here earns $50,041.
When is the best time to visit Buffalo?
By the 1991-2020 climate normals, May to September are the most comfortable months. July averages 80°F and January 32°F for daytime highs.
What county is Buffalo in?
Buffalo is in Erie County, New York. Source: Census Bureau 2020 geography.
What time zone is Buffalo in?
Buffalo is on Eastern Time (UTC-5, or UTC-4 during daylight saving time from March to November).
What is the elevation of Buffalo?
About 600 feet above sea level at the city center. Elevation varies across the city.
Does New York have a state income tax?
Yes. New York has a graduated income tax with a top rate of 10.9% for 2026. Some cities add a local income tax, which is not included here.
Sources
Population: Census Bureau Vintage 2025 estimates (July 1, 2025). Income, housing, education and commuting: American Community Survey 2020-2024 5-year estimates for the city of Buffalo. Price levels: BEA Regional Price Parities 2024 for the Buffalo-Cheektowaga, NY metro area. Weather: NOAA 1991-2020 normals, Buffalo, NY station. Taxes: Tax Foundation 2026. How we get our numbers.