| # | City | Population 2025 | Growth since 2020 | Land area (sq mi) | Median age |
|---|---|---|---|---|---|
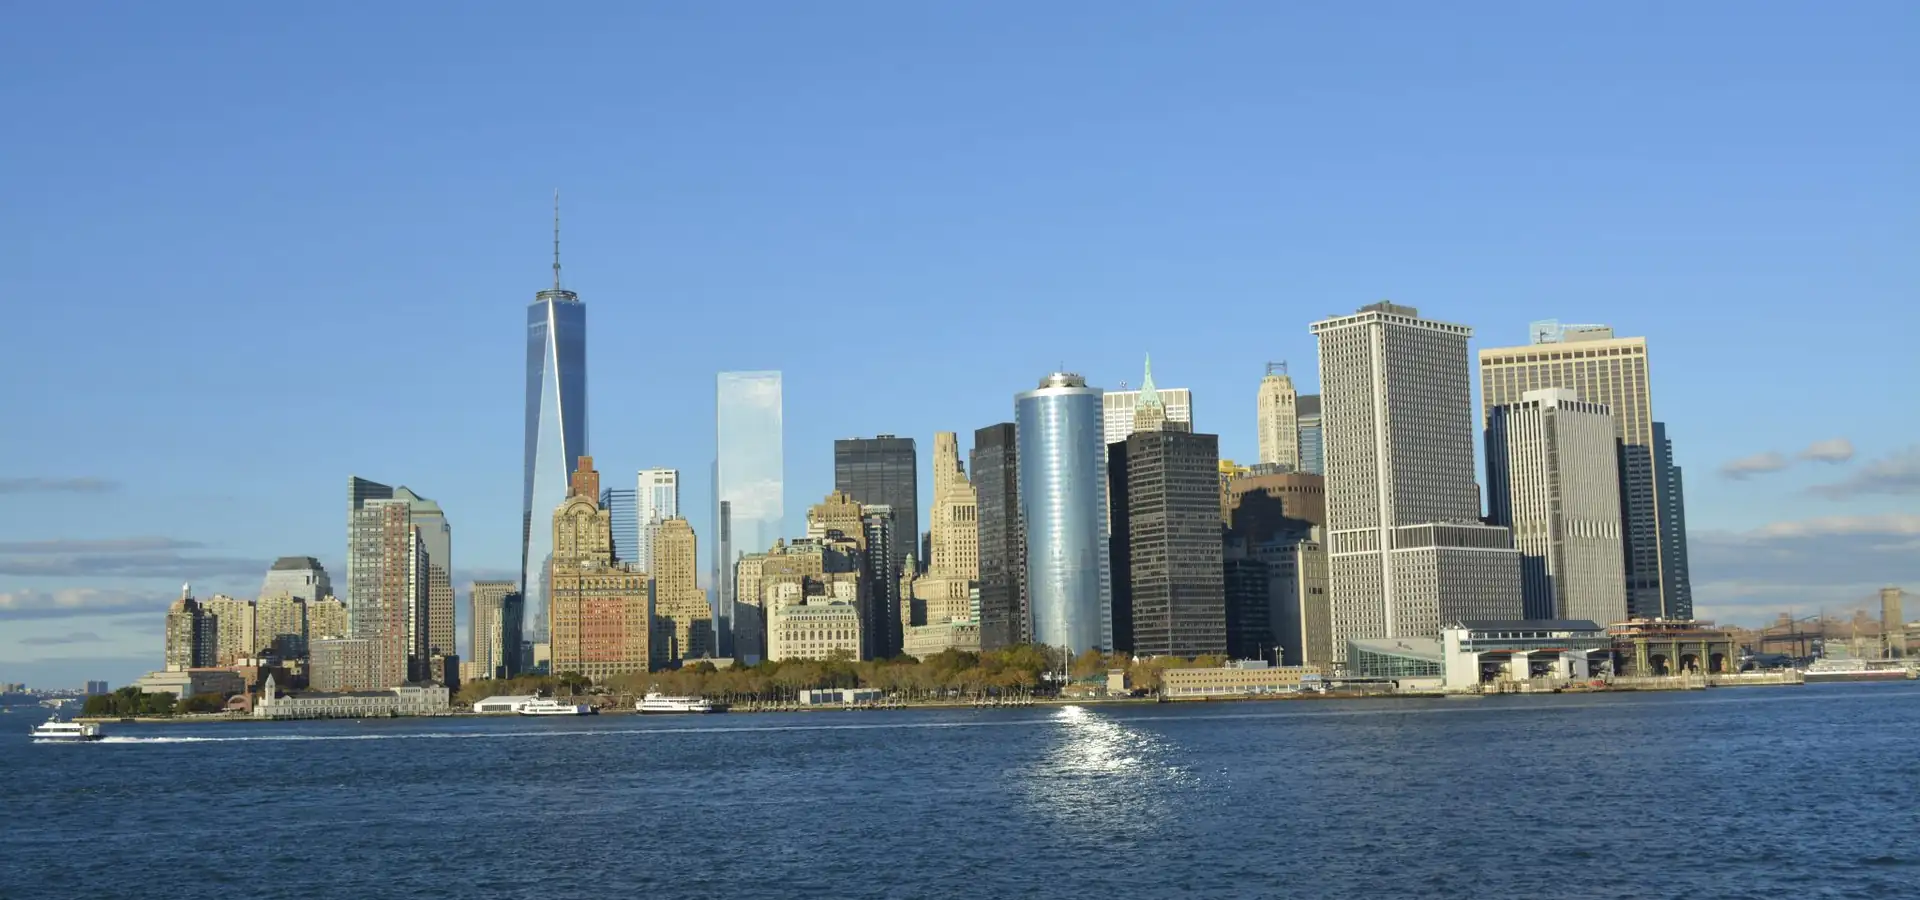
| 1 | New York, NY | 8,584,629 | -2.5% | 301 | 38.2 |
| 2 | Los Angeles, CA | 3,869,089 | -0.8% | 471 | 37.2 |
| 3 | Chicago, IL | 2,731,585 | -0.6% | 228 | 35.8 |
| 4 | Houston, TX | 2,397,315 | +4.2% | 641 | 34.4 |
| 5 | Phoenix, AZ | 1,665,481 | +3.6% | 518 | 34.9 |
| 6 | Philadelphia, PA | 1,574,281 | -1.8% | 134 | 35.3 |
| 7 | San Antonio, TX | 1,548,422 | +8% | 499 | 34.9 |
| 8 | San Diego, CA | 1,406,106 | +1.6% | 326 | 36.2 |
| 9 | Dallas, TX | 1,329,491 | +1.9% | 340 | 33.4 |
| 10 | Fort Worth, TX | 1,028,117 | +11.9% | 352 | 33.6 |
| 11 | Jacksonville, FL | 1,017,689 | +7.2% | 747 | 36.5 |
| 12 | Austin, TX | 1,002,632 | +4.6% | 326 | 34.7 |
| 13 | San Jose, CA | 989,814 | -2.3% | 178 | 38.2 |
| 14 | Charlotte, NC | 964,784 | +10.3% | 312 | 34.5 |
| 15 | Columbus, OH | 938,396 | +3.6% | 222 | 33.2 |
| 16 | Indianapolis, IN | 901,116 | +1.5% | 361 | 34.3 |
| 17 | San Francisco, CA | 826,079 | -6% | 47 | 40.0 |
| 18 | Seattle, WA | 784,777 | +6.5% | 84 | 35.6 |
| 19 | Denver, CO | 740,613 | +3.5% | 153 | 35.3 |
| 20 | Nashville, TN | 721,074 | +4.6% | 476 | 34.5 |
| 21 | Oklahoma City, OK | 719,849 | +5.7% | 607 | 35.1 |
| 22 | Washington, DC | 693,645 | +0.6% | 61 | 34.9 |
| 23 | El Paso, TX | 683,012 | +0.6% | 259 | 34.5 |
| 24 | Las Vegas, NV | 679,817 | +5.3% | 142 | 38.6 |
| 25 | Boston, MA | 672,973 | -0.8% | 48 | 33.3 |
| 26 | Detroit, MI | 649,095 | +1.5% | 139 | 35.2 |
| 27 | Louisville, KY | 641,962 | +1.6% | 263 | 37.7 |
| 28 | Portland, OR | 635,109 | -2.7% | 134 | 38.8 |
| 29 | Memphis, TN | 609,647 | -3% | 290 | 34.2 |
| 30 | Baltimore, MD | 569,997 | -2.7% | 81 | 36.2 |
| 31 | Milwaukee, WI | 562,407 | -2.7% | 96 | 32.4 |
| 32 | Albuquerque, NM | 556,588 | -1.4% | 187 | 38.8 |
| 33 | Fresno, CA | 555,549 | +2.5% | 116 | 32.8 |
| 34 | Tucson, AZ | 548,371 | +1.1% | 242 | 34.6 |
| 35 | Sacramento, CA | 536,449 | +2.2% | 99 | 36.0 |
| 36 | Atlanta, GA | 529,110 | +6.1% | 135 | 34.2 |
| 37 | Kansas City, MO | 521,220 | +2.6% | 315 | 35.8 |
| 38 | Mesa, AZ | 513,656 | +1.8% | 142 | 37.4 |
| 39 | Raleigh, NC | 506,306 | +8.2% | 151 | 34.7 |
| 40 | Colorado Springs, CO | 494,743 | +3.1% | 202 | 35.7 |
| 41 | Miami, FL | 489,812 | +10.8% | 36 | 39.3 |
| 42 | Omaha, NE | 488,797 | -0.6% | 143 | 35.3 |
| 43 | Virginia Beach, VA | 453,737 | -1.2% | 245 | 37.9 |
| 44 | Long Beach, CA | 450,469 | -3.5% | 51 | 37.1 |
| 45 | Oakland, CA | 440,838 | +0% | 56 | 37.9 |
| 46 | Minneapolis, MN | 430,324 | +0.1% | 54 | 33.4 |
| 47 | Bakersfield, CA | 422,165 | +4.4% | 150 | 32.1 |
| 48 | Tulsa, OK | 416,209 | +0.8% | 198 | 35.6 |
| 49 | Tampa, FL | 413,554 | +7.3% | 115 | 35.9 |
| 50 | Aurora, CO | 410,053 | +6.2% | 164 | 35.3 |
| 51 | Arlington, TX | 402,134 | +2% | 96 | 33.7 |
| 52 | Wichita, KS | 400,987 | +0.9% | 165 | 35.7 |
| 53 | Cleveland, OH | 363,608 | -2.4% | 78 | 36.3 |
| 54 | New Orleans, LA | 362,154 | -5.7% | 170 | 38.8 |
| 55 | Henderson, NV | 353,289 | +11.5% | 121 | 42.8 |
| 56 | Honolulu, HI | 341,868 | -2.6% | 61 | 43.0 |
| 57 | Anaheim, CA | 341,008 | -1.7% | 50 | 36.2 |
| 58 | Orlando, FL | 333,888 | +8.4% | 111 | 35.1 |
| 59 | Lexington, KY | 329,751 | +2.2% | 284 | 35.3 |
| 60 | Stockton, CA | 324,597 | +1.2% | 63 | 33.9 |
| 61 | Newark, NJ | 323,808 | +4% | 24 | 34.7 |
| 62 | Riverside, CA | 323,057 | +2.4% | 81 | 33.6 |
| 63 | Irvine, CA | 318,764 | +3.6% | 66 | 34.0 |
| 64 | Corpus Christi, TX | 317,247 | -0.3% | 166 | 36.9 |
| 65 | Santa Ana, CA | 315,586 | +1.6% | 27 | 34.7 |
| 66 | Cincinnati, OH | 314,367 | +1.5% | 78 | 33.2 |
| 67 | Greensboro, NC | 308,667 | +3.2% | 134 | 34.3 |
| 68 | Pittsburgh, PA | 307,632 | +1.5% | 55 | 33.6 |
| 69 | St. Paul, MN | 306,684 | -1.5% | 52 | 33.7 |
| 70 | Durham, NC | 305,561 | +7.6% | 119 | 35.1 |
| 71 | Jersey City, NJ | 302,013 | +3.2% | 15 | 34.7 |
| 72 | Lincoln, NE | 301,522 | +3.5% | 101 | 33.4 |
| 73 | North Las Vegas, NV | 296,653 | +14.3% | 105 | 34.2 |
| 74 | Plano, TX | 293,028 | +2.6% | 72 | 39.6 |
| 75 | Gilbert, AZ | 287,285 | +7.2% | 69 | 36.1 |
| 76 | Anchorage, AK | 287,155 | -1.4% | 1,707 | 35.2 |
| 77 | Madison, WI | 286,233 | +4.2% | 84 | 31.8 |
| 78 | Reno, NV | 283,621 | +7.4% | 109 | 37.1 |
| 79 | Chandler, AZ | 278,748 | +1% | 66 | 37.5 |
| 80 | St. Louis, MO | 278,144 | -7.7% | 62 | 36.8 |
| 81 | Chula Vista, CA | 275,533 | +0% | 50 | 37.1 |
| 82 | Fort Wayne, IN | 275,203 | +4.3% | 112 | 35.0 |
| 83 | Buffalo, NY | 274,613 | -1.3% | 40 | 34.3 |
| 84 | Lubbock, TX | 273,071 | +6.2% | 143 | 30.5 |
| 85 | Laredo, TX | 269,515 | +5.6% | 109 | 29.9 |
| 86 | Port St. Lucie, FL | 268,062 | +30.9% | 119 | 43.9 |
| 87 | St. Petersburg, FL | 264,033 | +2.2% | 62 | 43.1 |
| 88 | Toledo, OH | 263,423 | -2.8% | 81 | 35.8 |
| 89 | Glendale, AZ | 260,572 | +4.9% | 67 | 34.6 |
| 90 | Winston-Salem, NC | 257,271 | +3.1% | 134 | 35.9 |
| 91 | Irving, TX | 257,076 | +0.1% | 67 | 32.8 |
| 92 | Chesapeake, VA | 255,332 | +2.4% | 339 | 37.9 |
| 93 | Garland, TX | 249,625 | +1.4% | 57 | 35.0 |
| 94 | Scottsdale, AZ | 243,006 | +0.7% | 184 | 49.0 |
| 95 | Boise, ID | 238,429 | +1.1% | 85 | 38.6 |
| 96 | Richmond, VA | 237,257 | +4.7% | 60 | 34.7 |
| 97 | Frisco, TX | 236,955 | +18.2% | 69 | 38.3 |
| 98 | Cape Coral, FL | 236,264 | +21.8% | 106 | 48.6 |
| 99 | McKinney, TX | 236,001 | +20.8% | 68 | 36.9 |
| 100 | Huntsville, AL | 233,627 | +8.7% | 225 | 36.9 |
| 101 | Norfolk, VA | 231,013 | -3% | 53 | 32.7 |
| 102 | Hialeah, FL | 230,968 | +3.5% | 22 | 45.8 |
| 103 | Spokane, WA | 230,783 | +0.8% | 69 | 37.2 |
| 104 | Tacoma, WA | 229,816 | +4.6% | 50 | 37.2 |
| 105 | Santa Clarita, CA | 228,430 | -1.9% | 74 | 38.4 |
| 106 | Fremont, CA | 226,442 | -1.8% | 78 | 39.1 |
| 107 | Baton Rouge, LA | 222,795 | -1.7% | 87 | 31.5 |
| 108 | San Bernardino, CA | 222,044 | +0% | 62 | 32.2 |
| 109 | Fontana, CA | 221,223 | +6.1% | 43 | 33.8 |
| 110 | Modesto, CA | 219,652 | +0.5% | 43 | 35.1 |
| 111 | Salt Lake City, UT | 218,428 | +9.4% | 111 | 32.9 |
| 112 | Moreno Valley, CA | 214,263 | +2.7% | 51 | 32.5 |
| 113 | Worcester, MA | 213,862 | +3.6% | 37 | 33.9 |
| 114 | Sioux Falls, SD | 213,748 | +10.9% | 84 | 35.5 |
| 115 | Yonkers, NY | 212,603 | +0.5% | 18 | 39.9 |
| 116 | Des Moines, IA | 212,086 | -0.9% | 88 | 34.6 |
| 117 | Grand Prairie, TX | 209,434 | +6.8% | 72 | 34.4 |
| 118 | Fayetteville, NC | 209,120 | +0.3% | 148 | 30.6 |
| 119 | Little Rock, AR | 206,427 | +1.9% | 121 | 35.9 |
| 120 | Rochester, NY | 206,108 | -2.4% | 36 | 33.7 |
| 121 | Amarillo, TX | 205,130 | +2.4% | 104 | 35.1 |
| 122 | Tallahassee, FL | 204,902 | +4.4% | 103 | 28.2 |
| 123 | Overland Park, KS | 203,677 | +3.3% | 75 | 38.6 |
| 124 | Columbus, GA | 202,171 | -2.3% | 217 | 35.4 |
| 125 | Knoxville, TN | 202,021 | +6% | 99 | 33.5 |
| 126 | Augusta, GA | 201,999 | +0% | 302 | 35.2 |
| 127 | Grand Rapids, MI | 201,183 | +1.2% | 45 | 32.3 |
| 128 | Peoria, AZ | 200,881 | +5.2% | 177 | 41.7 |
| 129 | Mobile, AL | 200,824 | -2.9% | 151 | 37.3 |
| 130 | Vancouver, WA | 199,698 | +4.6% | 49 | 37.9 |
| 131 | Oxnard, CA | 199,651 | -1.2% | 27 | 34.4 |
| 132 | Birmingham, AL | 195,893 | -2.3% | 147 | 35.6 |
| 133 | Providence, RI | 195,310 | +2.3% | 18 | 32.8 |
| 134 | Montgomery, AL | 195,300 | -2.6% | 160 | 36.6 |
| 135 | Chattanooga, TN | 194,144 | +6.9% | 142 | 36.3 |
| 136 | Brownsville, TX | 192,957 | +3.6% | 133 | 31.2 |
| 137 | Huntington Beach, CA | 191,451 | -3.7% | 27 | 44.0 |
| 138 | Tempe, AZ | 190,571 | +3.5% | 40 | 30.0 |
| 139 | Akron, OH | 189,691 | -0.4% | 62 | 36.9 |
| 140 | Clarksville, TN | 188,829 | +13.2% | 100 | 31.0 |
| 141 | Fort Lauderdale, FL | 188,677 | +3.3% | 35 | 42.8 |
| 142 | Glendale, CA | 187,160 | -4.8% | 31 | 41.4 |
| 143 | Ontario, CA | 187,013 | +6.7% | 50 | 33.5 |
| 144 | Elk Grove, CA | 185,007 | +5% | 43 | 39.4 |
| 145 | Cary, NC | 183,582 | +5% | 61 | 40.2 |
| 146 | Newport News, VA | 183,230 | -1.6% | 69 | 34.4 |
| 147 | Salem, OR | 181,779 | +3.6% | 49 | 36.0 |
| 148 | Aurora, IL | 181,505 | +0.5% | 45 | 35.2 |
| 149 | Santa Rosa, CA | 179,437 | +0.8% | 43 | 41.2 |
| 150 | Eugene, OR | 178,618 | +0.7% | 45 | 35.2 |
| 151 | Rancho Cucamonga, CA | 177,856 | +1.9% | 47 | 38.6 |
| 152 | Pembroke Pines, FL | 176,714 | +3.2% | 33 | 44.3 |
| 153 | Shreveport, LA | 175,902 | -6.2% | 108 | 37.9 |
| 154 | Surprise, AZ | 175,304 | +22.5% | 111 | 41.4 |
| 155 | Fort Collins, CO | 171,500 | +1% | 57 | 30.9 |
| 156 | Murfreesboro, TN | 171,178 | +12% | 65 | 31.6 |
| 157 | Oceanside, CA | 170,483 | -2.1% | 41 | 38.9 |
| 158 | Garden Grove, CA | 170,455 | -0.9% | 18 | 40.2 |
| 159 | Lancaster, CA | 170,084 | -2% | 94 | 34.5 |
| 160 | Springfield, MO | 169,847 | +0.4% | 83 | 33.7 |
| 161 | Denton, TX | 169,431 | +21.1% | 97 | 31.4 |
| 162 | Roseville, CA | 167,302 | +13.2% | 44 | 40.2 |
| 163 | Killeen, TX | 161,883 | +5.7% | 55 | 30.3 |
| 164 | Palmdale, CA | 161,845 | -4.5% | 106 | 33.0 |
| 165 | Paterson, NJ | 161,793 | +1.3% | 8 | 33.3 |
| 166 | Corona, CA | 161,734 | +2.9% | 40 | 37.5 |
| 167 | Alexandria, VA | 160,662 | +0.7% | 15 | 37.7 |
| 168 | Charleston, SC | 159,423 | +5.8% | 115 | 36.6 |
| 169 | Salinas, CA | 159,134 | -2.7% | 24 | 32.4 |
| 170 | Kansas City, KS | 157,805 | +0.8% | 125 | 33.9 |
| 171 | Macon, GA | 157,556 | +0.1% | 249 | 36.8 |
| 172 | Hayward, CA | 157,113 | -3.6% | 46 | 38.6 |
| 173 | Hollywood, FL | 157,019 | +2.6% | 27 | 40.9 |
| 174 | Lakewood, CO | 156,927 | +0.6% | 44 | 38.2 |
| 175 | Sunnyvale, CA | 156,577 | +0.6% | 22 | 35.2 |
| 176 | Springfield, MA | 154,702 | -0.8% | 32 | 33.7 |
| 177 | Bellevue, WA | 154,193 | +1.5% | 34 | 38.5 |
| 178 | Naperville, IL | 153,114 | +2.4% | 39 | 40.4 |
| 179 | Bridgeport, CT | 152,273 | +2.5% | 16 | 36.7 |
| 180 | Joliet, IL | 152,241 | +1.2% | 66 | 35.8 |
| 181 | Mesquite, TX | 150,693 | +0.3% | 49 | 32.9 |
| 182 | McAllen, TX | 150,640 | +5.9% | 62 | 33.5 |
| 183 | Olathe, KS | 150,025 | +6.2% | 64 | 37.2 |
| 184 | Savannah, GA | 149,440 | +1.1% | 109 | 34.0 |
| 185 | Gainesville, FL | 148,671 | +5.3% | 64 | 26.5 |
| 186 | Pasadena, TX | 148,539 | -2.2% | 44 | 33.0 |
| 187 | Palm Bay, FL | 148,092 | +23.7% | 87 | 41.0 |
| 188 | Pomona, CA | 147,807 | -2.4% | 23 | 36.0 |
| 189 | Waco, TX | 147,788 | +5.5% | 91 | 29.7 |
| 190 | Thornton, CO | 147,766 | +4.2% | 37 | 34.7 |
| 191 | Midland, TX | 147,615 | +11.1% | 76 | 31.5 |
| 192 | Rockford, IL | 147,384 | -1.1% | 65 | 37.7 |
| 193 | Columbia, SC | 147,035 | +7.5% | 139 | 28.6 |
| 194 | Visalia, CA | 146,541 | +3.5% | 39 | 33.9 |
| 195 | Escondido, CA | 146,030 | -3.3% | 37 | 36.9 |
| 196 | Syracuse, NY | 144,896 | -2.5% | 25 | 31.8 |
| 197 | Meridian, ID | 142,988 | +21.4% | 37 | 37.5 |
| 198 | Miramar, FL | 142,570 | +5.8% | 29 | 39.3 |
| 199 | Elizabeth, NJ | 141,675 | +3.2% | 12 | 35.8 |
| 200 | Victorville, CA | 141,395 | +4.9% | 74 | 32.3 |
| 201 | Round Rock, TX | 141,282 | +18.2% | 38 | 36.2 |
| 202 | Jackson, MS | 141,196 | -8.1% | 112 | 34.5 |
| 203 | Stamford, CT | 139,535 | +3% | 38 | 38.4 |
| 204 | Lewisville, TX | 139,006 | +10.6% | 41 | 35.0 |
| 205 | Coral Springs, FL | 138,783 | +3.3% | 23 | 37.5 |
| 206 | New Haven, CT | 138,774 | +3.6% | 19 | 31.9 |
| 207 | Fullerton, CA | 138,675 | -3.5% | 22 | 36.9 |
| 208 | Torrance, CA | 138,391 | -5.8% | 21 | 43.2 |
| 209 | Orange, CA | 138,365 | -1.1% | 26 | 37.2 |
| 210 | Cedar Rapids, IA | 137,935 | +0.1% | 75 | 37.3 |
| 211 | West Valley City, UT | 137,491 | -2% | 36 | 31.2 |
| 212 | Hampton, VA | 137,315 | +0.1% | 52 | 36.8 |
| 213 | Warren, MI | 137,138 | -1.6% | 34 | 38.3 |
| 214 | Dayton, OH | 136,688 | -0.7% | 56 | 34.1 |
| 215 | Fargo, ND | 136,275 | +8.2% | 52 | 31.8 |
| 216 | Pasadena, CA | 135,804 | -2.7% | 23 | 40.1 |
| 217 | Kent, WA | 134,871 | -0.4% | 34 | 35.5 |
| 218 | Carrollton, TX | 134,562 | +0.8% | 37 | 39.2 |
| 219 | Sterling Heights, MI | 133,931 | -0.3% | 36 | 41.7 |
| 220 | Santa Clara, CA | 133,446 | +4.3% | 18 | 34.6 |
| 221 | Abilene, TX | 131,588 | +5.3% | 107 | 32.8 |
| 222 | Norman, OK | 130,943 | +2.3% | 179 | 32.5 |
| 223 | Columbia, MO | 130,851 | +3.8% | 68 | 29.5 |
| 224 | Pearland, TX | 129,930 | +1.8% | 49 | 37.1 |
| 225 | Clovis, CA | 129,347 | +7.6% | 26 | 36.0 |
| 226 | North Charleston, SC | 129,245 | +12.5% | 78 | 34.6 |
| 227 | Athens, GA | 128,612 | +1% | 116 | 29.4 |
| 228 | College Station, TX | 127,472 | +5.8% | 51 | 22.9 |
| 229 | West Palm Beach, FL | 127,189 | +8.4% | 54 | 41.1 |
| 230 | Wilmington, NC | 126,809 | +9.8% | 51 | 37.1 |
| 231 | Allentown, PA | 126,044 | +0.1% | 18 | 33.1 |
| 232 | Topeka, KS | 125,795 | -0.6% | 62 | 38.0 |
| 233 | Lakeland, FL | 125,520 | +11.5% | 67 | 38.9 |
| 234 | Buckeye, AZ | 125,445 | +37.1% | 395 | 35.7 |
| 235 | Goodyear, AZ | 125,359 | +30.4% | 191 | 42.1 |
| 236 | Broken Arrow, OK | 124,991 | +10.1% | 63 | 37.1 |
| 237 | Simi Valley, CA | 124,861 | -1.2% | 42 | 41.9 |
| 238 | Rochester, MN | 124,292 | +2.4% | 57 | 36.3 |
| 239 | Lafayette, LA | 123,311 | +1.6% | 56 | 36.9 |
| 240 | Vallejo, CA | 123,287 | -2.2% | 30 | 40.6 |
| 241 | Concord, CA | 123,261 | -1.7% | 31 | 39.1 |
| 242 | Arvada, CO | 122,901 | -1.2% | 39 | 40.0 |
| 243 | Odessa, TX | 122,707 | +7.2% | 52 | 31.1 |
| 244 | Cambridge, MA | 122,588 | +3.5% | 6 | 30.4 |
| 245 | New Braunfels, TX | 122,492 | +35.5% | 45 | 37.1 |
| 246 | Fairfield, CA | 122,489 | +2.1% | 42 | 36.9 |
| 247 | Ann Arbor, MI | 122,233 | -1.3% | 28 | 27.7 |
| 248 | Thousand Oaks, CA | 122,230 | -3.7% | 55 | 44.9 |
| 249 | Hartford, CT | 121,981 | +0.3% | 17 | 33.1 |
| 250 | Berkeley, CA | 121,911 | -1.9% | 10 | 33.2 |
| 251 | Independence, MO | 121,675 | -1% | 78 | 39.0 |
| 252 | Billings, MT | 121,239 | +3.5% | 46 | 38.8 |
| 253 | High Point, NC | 120,571 | +5.7% | 57 | 37.7 |
| 254 | Nampa, ID | 120,384 | +19.9% | 36 | 33.9 |
| 255 | Lowell, MA | 119,971 | +3.8% | 14 | 35.6 |
| 256 | League City, TX | 119,905 | +4.9% | 51 | 37.7 |
| 257 | Conroe, TX | 119,564 | +33% | 76 | 33.7 |
| 258 | Antioch, CA | 118,958 | +3.2% | 29 | 38.4 |
| 259 | Menifee, CA | 118,592 | +15.7% | 47 | 38.1 |
| 260 | Richardson, TX | 118,542 | -0.8% | 29 | 33.9 |
| 261 | Pompano Beach, FL | 117,211 | +4.6% | 24 | 41.3 |
| 262 | Las Cruces, NM | 116,978 | +5% | 77 | 33.0 |
| 263 | Manchester, NH | 116,818 | +1% | 33 | 38.0 |
| 264 | West Jordan, UT | 116,812 | -0.1% | 33 | 33.3 |
| 265 | Westminster, CO | 116,182 | -0.4% | 32 | 37.4 |
| 266 | Evansville, IN | 116,176 | -0.9% | 47 | 38.2 |
| 267 | Waterbury, CT | 115,771 | +1.2% | 29 | 37.8 |
| 268 | Elgin, IL | 115,476 | +0.6% | 38 | 36.7 |
| 269 | Greeley, CO | 115,073 | +5.8% | 50 | 32.5 |
| 270 | Temecula, CA | 114,865 | +4.4% | 37 | 36.7 |
| 271 | Richmond, CA | 114,861 | -1.2% | 30 | 37.9 |
| 272 | Concord, NC | 114,598 | +8.8% | 65 | 36.5 |
| 273 | Provo, UT | 114,527 | -0.6% | 42 | 23.6 |
| 274 | Rio Rancho, NM | 114,419 | +9.9% | 103 | 39.5 |
| 275 | Clearwater, FL | 114,364 | -2.5% | 26 | 46.6 |
| 276 | Tuscaloosa, AL | 114,316 | +13.2% | 63 | 27.2 |
| 277 | Murrieta, CA | 114,124 | +2.8% | 35 | 36.6 |
| 278 | Lansing, MI | 113,884 | +1.1% | 39 | 33.7 |
| 279 | Tyler, TX | 113,723 | +7.4% | 58 | 35.0 |
| 280 | Miami Gardens, FL | 113,579 | +1.9% | 19 | 39.4 |
| 281 | Everett, WA | 113,567 | +2.8% | 34 | 37.2 |
| 282 | Allen, TX | 113,447 | +8.4% | 26 | 38.4 |
| 283 | Springfield, IL | 112,989 | -1.4% | 61 | 41.0 |
| 284 | Beaumont, TX | 112,967 | -1.8% | 82 | 35.3 |
| 285 | South Fulton, GA | 112,820 | +4.4% | 93 | 36.3 |
| 286 | Carlsbad, CA | 112,260 | -2.2% | 38 | 42.5 |
| 287 | Sparks, NV | 111,902 | +3.2% | 37 | 37.2 |
| 288 | Gresham, OR | 111,513 | -2.4% | 24 | 37.0 |
| 289 | Santa Maria, CA | 111,390 | +1.5% | 23 | 29.3 |
| 290 | Hillsboro, OR | 111,126 | +4.4% | 26 | 35.0 |
| 291 | Peoria, IL | 110,920 | -2% | 48 | 35.5 |
| 292 | Davie, FL | 110,851 | +4.8% | 35 | 37.9 |
| 293 | Edinburg, TX | 110,700 | +10.4% | 47 | 30.2 |
| 294 | Pueblo, CO | 110,404 | -1.3% | 57 | 38.4 |
| 295 | Ventura, CA | 109,914 | -0.8% | 22 | 41.3 |
| 296 | Palm Coast, FL | 109,886 | +23.2% | 96 | 50.4 |
| 297 | Costa Mesa, CA | 108,881 | -2.9% | 16 | 36.7 |
| 298 | St. George, UT | 108,713 | +14% | 77 | 38.3 |
| 299 | Centennial, CO | 108,658 | +0.6% | 30 | 42.0 |
| 300 | Downey, CA | 108,468 | -5.1% | 12 | 37.7 |
| 301 | Spokane Valley, WA | 108,405 | +5.2% | 38 | 38.3 |
| 302 | Sugar Land, TX | 107,726 | -3% | 41 | 42.8 |
| 303 | Lee's Summit, MO | 107,514 | +6.3% | 64 | 38.8 |
| 304 | Bend, OR | 107,342 | +8.2% | 35 | 40.9 |
| 305 | Jurupa Valley, CA | 107,311 | +2.2% | 43 | 34.5 |
| 306 | Georgetown, TX | 106,907 | +58.5% | 58 | 42.6 |
| 307 | Green Bay, WI | 106,675 | -0.6% | 46 | 36.0 |
| 308 | Fayetteville, AR | 106,623 | +13.1% | 55 | 28.8 |
| 309 | Rialto, CA | 106,554 | +2.5% | 24 | 32.6 |
| 310 | Brockton, MA | 106,134 | +0.5% | 21 | 36.7 |
| 311 | Boulder, CO | 105,689 | -2.6% | 27 | 28.8 |
| 312 | Carmel, IN | 105,634 | +5.9% | 49 | 40.6 |
| 313 | Dearborn, MI | 105,611 | -4% | 24 | 33.3 |
| 314 | West Covina, CA | 105,301 | -3.8% | 16 | 40.5 |
| 315 | Yuma, AZ | 105,227 | +8.4% | 121 | 33.1 |
| 316 | Chico, CA | 105,081 | +0.5% | 34 | 31.1 |
| 317 | El Monte, CA | 105,075 | -4% | 10 | 37.8 |
| 318 | Sandy Springs, GA | 105,013 | -2.9% | 38 | 36.8 |
| 319 | Renton, WA | 104,975 | -1.8% | 24 | 36.5 |
| 320 | Fishers, IN | 104,812 | +5.8% | 36 | 37.6 |
| 321 | Suffolk, VA | 104,699 | +10.9% | 399 | 38.7 |
| 322 | Lynn, MA | 104,236 | +2.9% | 11 | 36.5 |
| 323 | Vacaville, CA | 103,850 | +1.4% | 30 | 38.2 |
| 324 | San Mateo, CA | 103,337 | -2.2% | 12 | 38.3 |
| 325 | South Bend, IN | 103,201 | -0.2% | 42 | 34.8 |
| 326 | Quincy, MA | 103,173 | +1.5% | 17 | 38.6 |
| 327 | Burbank, CA | 102,988 | -4% | 17 | 40.1 |
| 328 | Hesperia, CA | 102,605 | +2.8% | 73 | 32.7 |
| 329 | Wichita Falls, TX | 101,951 | -0.3% | 72 | 33.8 |
| 330 | Tracy, CA | 101,901 | +9.4% | 26 | 35.6 |
| 331 | New Bedford, MA | 101,834 | +0.8% | 20 | 37.0 |
| 332 | El Cajon, CA | 101,755 | -4.2% | 15 | 36.1 |
| 333 | Albany, NY | 101,698 | +2.6% | 21 | 32.0 |
| 334 | Inglewood, CA | 101,662 | -5.7% | 9 | 38.6 |
| 335 | Boca Raton, FL | 101,582 | +4.2% | 29 | 46.0 |
| 336 | Fort Myers, FL | 101,581 | +17.5% | 40 | 41.3 |
| 337 | Daly City, CA | 101,261 | -3.5% | 8 | 42.6 |
| 338 | Avondale, AZ | 100,983 | +13.1% | 48 | 33.4 |
| 339 | San Angelo, TX | 100,640 | +0.7% | 60 | 35.5 |
| 340 | Edmond, OK | 100,479 | +6.4% | 84 | 37.9 |
| 341 | Davenport, IA | 100,358 | -1.3% | 64 | 37.5 |
| 342 | Deltona, FL | 100,267 | +7% | 37 | 38.5 |
| 343 | Longmont, CO | 100,109 | +1.2% | 29 | 40.3 |
| 344 | Federal Way, WA | 99,729 | -1.3% | 22 | 37.4 |
| 345 | Merced, CA | 99,724 | +11% | 23 | 30.0 |
| 346 | Kenosha, WI | 99,239 | -0.8% | 29 | 37.1 |
| 347 | Plantation, FL | 99,183 | +8.2% | 22 | 40.2 |
| 348 | Roanoke, VA | 99,111 | -0.9% | 43 | 38.3 |
| 349 | Sunrise, FL | 98,846 | +1.5% | 16 | 41.7 |
| 350 | Temple, TX | 98,412 | +19.7% | 73 | 33.8 |
| 351 | Vista, CA | 98,274 | -0.5% | 19 | 35.9 |
| 352 | Beaverton, OR | 97,842 | +0.3% | 20 | 37.8 |
| 353 | Yakima, WA | 97,458 | +0.5% | 28 | 34.3 |
| 354 | Kirkland, WA | 97,410 | +5.7% | 18 | 38.3 |
| 355 | Norwalk, CA | 97,104 | -5.5% | 10 | 37.3 |
| 356 | Chino, CA | 96,957 | +5.6% | 30 | 36.2 |
| 357 | Portsmouth, VA | 96,777 | -1.2% | 33 | 35.9 |
| 358 | Manteca, CA | 96,693 | +15.7% | 22 | 36.8 |
| 359 | North Port, FL | 96,551 | +28.7% | 99 | 49.3 |
| 360 | Greenville, NC | 96,443 | +8% | 38 | 27.3 |
| 361 | Bellingham, WA | 96,395 | +5.4% | 28 | 34.1 |
| 362 | Lawrence, KS | 96,367 | +1.5% | 35 | 29.3 |
| 363 | O'Fallon, MO | 96,101 | +5.2% | 31 | 38.4 |
| 364 | Reading, PA | 95,832 | +0.8% | 10 | 31.9 |
| 365 | Mount Pleasant, SC | 95,469 | +4.9% | 50 | 42.6 |
| 366 | Lehi, UT | 95,313 | +25.6% | 30 | 26.9 |
| 367 | Fall River, MA | 95,298 | +1.4% | 33 | 39.3 |
| 368 | Orem, UT | 95,214 | -2.9% | 19 | 27.0 |
| 369 | San Marcos, CA | 94,908 | +0.1% | 25 | 36.8 |
| 370 | Norwalk, CT | 94,508 | +3.6% | 23 | 40.6 |
| 371 | Indio, CA | 94,269 | +5.6% | 33 | 38.6 |
| 372 | Redding, CA | 94,092 | +0.2% | 60 | 38.8 |
| 373 | Hemet, CA | 93,649 | +4.3% | 29 | 39.8 |
| 374 | Hoover, AL | 93,550 | +1.1% | 50 | 38.4 |
| 375 | Asheville, NC | 93,523 | -1.3% | 46 | 40.7 |
| 376 | Livonia, MI | 92,603 | -3.1% | 36 | 44.8 |
| 377 | Nashua, NH | 92,435 | +1.2% | 31 | 40.0 |
| 378 | Sandy, UT | 92,386 | -5.2% | 24 | 37.6 |
| 379 | Frederick, MD | 92,059 | +17.8% | 24 | 37.1 |
| 380 | Bryan, TX | 91,996 | +9.6% | 55 | 32.0 |
| 381 | Folsom, CA | 91,983 | +14.3% | 28 | 41.0 |
| 382 | Erie, PA | 91,838 | -3.3% | 19 | 34.8 |
| 383 | Trenton, NJ | 91,506 | +0.8% | 8 | 34.8 |
| 384 | Roswell, GA | 91,505 | -1.4% | 41 | 40.5 |
| 385 | Champaign, IL | 91,195 | +3.3% | 23 | 26.6 |
| 386 | Leander, TX | 91,132 | +53.8% | 39 | 36.3 |
| 387 | Clifton, NJ | 91,127 | +1.4% | 11 | 41.6 |
| 388 | Fort Smith, AR | 90,855 | +1.9% | 64 | 36.5 |
| 389 | Carson, CA | 90,808 | -5% | 19 | 41.7 |
| 390 | Newton, MA | 90,741 | +2% | 18 | 42.1 |
| 391 | Springdale, AR | 90,685 | +3.9% | 50 | 32.3 |
| 392 | Lawton, OK | 90,503 | +0.1% | 82 | 32.3 |
| 393 | Compton, CA | 90,500 | -5.5% | 10 | 33.3 |
| 394 | Mission Viejo, CA | 90,484 | -3.4% | 18 | 45.5 |
| 395 | Franklin, TN | 90,226 | +8% | 45 | 38.6 |
| 396 | Santa Monica, CA | 90,082 | -3.2% | 8 | 42.7 |
| 397 | South Gate, CA | 90,071 | -2.9% | 7 | 36.3 |
| 398 | Santa Fe, NM | 89,837 | +2.7% | 52 | 46.3 |
| 399 | Queen Creek, AZ | 89,770 | +51.4% | 42 | 37.0 |
| 400 | Ogden, UT | 89,510 | +2.5% | 28 | 33.6 |
| 401 | Deerfield Beach, FL | 89,339 | +2.9% | 15 | 43.9 |
| 402 | Lawrence, MA | 89,320 | +0.2% | 7 | 32.6 |
| 403 | Bloomington, MN | 89,034 | -1% | 35 | 41.1 |
| 404 | Danbury, CT | 89,033 | +2.5% | 42 | 40.6 |
| 405 | Mission, TX | 88,992 | +3.7% | 36 | 34.9 |
| 406 | Westminster, CA | 88,966 | -2% | 10 | 43.2 |
| 407 | Troy, MI | 88,733 | +1.6% | 33 | 42.0 |
| 408 | Daytona Beach, FL | 88,471 | +23.6% | 67 | 40.3 |
| 409 | Kennewick, WA | 88,366 | +5.3% | 29 | 35.7 |
| 410 | Duluth, MN | 88,330 | +1.7% | 72 | 35.2 |
| 411 | Waukegan, IL | 87,940 | -1.5% | 24 | 35.5 |
| 412 | Warner Robins, GA | 87,761 | +9.2% | 39 | 31.9 |
| 413 | South Jordan, UT | 87,614 | +13.1% | 26 | 36.2 |
| 414 | Rancho Cordova, CA | 87,554 | +10.4% | 35 | 36.0 |
| 415 | Melbourne, FL | 87,097 | +2.8% | 44 | 42.5 |
| 416 | Gastonia, NC | 87,067 | +8.2% | 54 | 36.5 |
| 417 | Baytown, TX | 86,561 | +1.2% | 41 | 34.0 |
| 418 | Medford, OR | 86,494 | +0.5% | 29 | 38.9 |
| 419 | Santa Barbara, CA | 86,422 | -2.7% | 20 | 39.7 |
| 420 | Sioux City, IA | 86,356 | +0.5% | 59 | 34.9 |
| 421 | Citrus Heights, CA | 86,348 | -1.4% | 14 | 38.7 |
| 422 | Lake Forest, CA | 86,333 | +0.5% | 17 | 40.2 |
| 423 | Auburn, WA | 86,301 | -2.4% | 30 | 36.0 |
| 424 | Homestead, FL | 86,242 | +6.8% | 15 | 32.5 |
| 425 | San Ramon, CA | 86,209 | -0.3% | 20 | 41.6 |
| 426 | New Rochelle, NY | 85,864 | +7.7% | 10 | 42.3 |
| 427 | Whittier, CA | 85,815 | -3.5% | 15 | 38.4 |
| 428 | Kissimmee, FL | 85,591 | +8% | 22 | 36.1 |
| 429 | Mountain View, CA | 85,438 | +3.5% | 12 | 35.5 |
| 430 | San Leandro, CA | 85,353 | -6.2% | 13 | 41.9 |
| 431 | Layton, UT | 85,308 | +4.3% | 23 | 32.3 |
| 432 | Auburn, AL | 85,113 | +11.1% | 63 | 25.9 |
| 433 | Cranston, RI | 84,647 | +2.1% | 28 | 39.6 |
| 434 | Mansfield, TX | 84,444 | +16.3% | 37 | 36.4 |
| 435 | Somerville, MA | 84,211 | +4% | 4 | 31.9 |
| 436 | Warwick, RI | 84,187 | +1.6% | 35 | 44.3 |
| 437 | Castle Rock, CO | 83,815 | +14.6% | 35 | 36.5 |
| 438 | Brooklyn Park, MN | 83,543 | -3.4% | 26 | 35.2 |
| 439 | Livermore, CA | 83,457 | -5.1% | 27 | 40.7 |
| 440 | Bloomington, IN | 83,307 | +3.9% | 23 | 25.1 |
| 441 | Jonesboro, AR | 83,296 | +6.1% | 80 | 33.9 |
| 442 | Farmington Hills, MI | 83,291 | -0.9% | 33 | 42.6 |
| 443 | Perris, CA | 83,237 | +5.8% | 32 | 31.3 |
| 444 | Longview, TX | 83,236 | +1.8% | 56 | 35.3 |
| 445 | Pasco, WA | 82,848 | +7.1% | 39 | 30.3 |
| 446 | Hawthorne, CA | 82,741 | -6.1% | 6 | 33.9 |
| 447 | Lake Charles, LA | 82,676 | -2.7% | 48 | 36.6 |
| 448 | Redmond, WA | 82,506 | +12.6% | 17 | 35.0 |
| 449 | Boynton Beach, FL | 82,396 | +2.7% | 16 | 42.5 |
| 450 | Westland, MI | 82,333 | -3.6% | 20 | 38.1 |
| 451 | Redwood City, CA | 82,178 | -2.5% | 19 | 37.5 |
| 452 | Newport Beach, CA | 81,977 | -3.8% | 24 | 45.9 |
| 453 | Cicero, IL | 81,858 | -4% | 6 | 34.4 |
| 454 | Buena Park, CA | 81,741 | -2.7% | 11 | 37.3 |
| 455 | Doral, FL | 81,634 | +7.6% | 14 | 37.1 |
| 456 | Miami Beach, FL | 81,594 | -1.6% | 8 | 42.9 |
| 457 | Woodbury, MN | 81,558 | +8.6% | 35 | 38.0 |
| 458 | Loveland, CO | 81,387 | +6.6% | 36 | 40.7 |
| 459 | Lynchburg, VA | 81,347 | +3% | 49 | 28.6 |
| 460 | Pharr, TX | 80,830 | +1.4% | 24 | 29.7 |
| 461 | Largo, FL | 80,690 | -2.5% | 19 | 49.3 |
| 462 | Rapid City, SD | 80,589 | +7.8% | 56 | 39.1 |
| 463 | Apex, NC | 80,419 | +24.9% | 27 | 36.4 |
| 464 | Johns Creek, GA | 80,401 | -2.5% | 31 | 43.3 |
| 465 | Alhambra, CA | 79,820 | -3.7% | 8 | 41.5 |
| 466 | Bethlehem, PA | 79,644 | +5.1% | 19 | 36.1 |
| 467 | Flower Mound, TX | 79,540 | +4.7% | 42 | 43.5 |
| 468 | Upland, CA | 79,446 | +0.5% | 16 | 37.7 |
| 469 | Flint, MI | 79,306 | -2.4% | 33 | 36.9 |
| 470 | Lakeville, MN | 79,270 | +14.1% | 37 | 36.8 |
| 471 | Broomfield, CO | 79,174 | +6.8% | 33 | 38.6 |
| 472 | Cedar Park, TX | 79,032 | +1.8% | 26 | 37.7 |
| 473 | Plymouth, MN | 78,942 | -2.6% | 33 | 40.3 |
| 474 | Missoula, MT | 78,903 | +6.4% | 35 | 34.7 |
| 475 | Mableton, GA | 78,820 | +2.3% | 36 | 37.0 |
| 476 | Bloomington, IL | 78,804 | +0.1% | 27 | 36.2 |
| 477 | Milpitas, CA | 78,596 | -2.1% | 14 | 36.8 |
| 478 | Wyoming, MI | 78,588 | +2.7% | 25 | 34.0 |
| 479 | Parma, OH | 78,581 | -3.1% | 20 | 42.4 |
| 480 | Bowling Green, KY | 78,505 | +8.6% | 42 | 28.7 |
| 481 | Maricopa, AZ | 78,362 | +34.8% | 43 | 36.8 |
| 482 | Lakewood, CA | 78,010 | -5.4% | 9 | 39.4 |
| 483 | Bismarck, ND | 77,963 | +5.9% | 35 | 38.9 |
| 484 | Racine, WI | 77,908 | -0.5% | 16 | 34.7 |
| 485 | Tustin, CA | 77,843 | -2.6% | 11 | 37.5 |
| 486 | Ankeny, IA | 77,833 | +14.3% | 32 | 33.6 |
| 487 | San Marcos, TX | 77,830 | +14.9% | 40 | 25.5 |
| 488 | Marysville, WA | 77,686 | +9.9% | 21 | 38.0 |
| 489 | Pittsburg, CA | 77,542 | +1.5% | 18 | 36.6 |
| 490 | Rochester Hills, MI | 77,539 | +1.6% | 33 | 41.0 |
| 491 | Chino Hills, CA | 77,519 | -1.2% | 45 | 40.5 |
| 492 | Missouri City, TX | 77,327 | +4.2% | 29 | 40.5 |
| 493 | Flagstaff, AZ | 77,260 | +0.5% | 66 | 25.9 |
| 494 | Schaumburg, IL | 77,249 | -1.9% | 19 | 39.6 |
| 495 | Pawtucket, RI | 77,065 | +1.9% | 9 | 37.1 |
| 496 | Rogers, AR | 76,956 | +10.5% | 39 | 34.3 |
| 497 | Alameda, CA | 76,876 | -1.8% | 10 | 41.0 |
| 498 | Rocklin, CA | 76,821 | +7.3% | 20 | 38.4 |
| 499 | Caldwell, ID | 76,629 | +27.4% | 25 | 31.5 |
| 500 | Blaine, MN | 76,603 | +9.1% | 33 | 37.5 |
| 501 | Napa, CA | 76,562 | -3.5% | 18 | 41.5 |
| 502 | Gulfport, MS | 76,506 | +4.9% | 56 | 38.0 |
| 503 | Evanston, IL | 76,380 | -2.2% | 8 | 38.4 |
| 504 | New Britain, CT | 76,286 | +2.9% | 13 | 34.3 |
| 505 | Iowa City, IA | 76,229 | +1.9% | 26 | 26.2 |
| 506 | Arlington Heights, IL | 76,216 | -1.9% | 17 | 42.6 |
| 507 | Noblesville, IN | 76,111 | +8.9% | 35 | 35.9 |
| 508 | Southfield, MI | 76,111 | -0.6% | 26 | 42.3 |
| 509 | Rock Hill, SC | 75,911 | +2.1% | 45 | 35.7 |
| 510 | Hammond, IN | 75,712 | -2.7% | 23 | 36.0 |
| 511 | Lauderhill, FL | 75,668 | +1.5% | 9 | 38.4 |
| 512 | Scranton, PA | 75,514 | -1.1% | 25 | 37.2 |
| 513 | Appleton, WI | 75,452 | -0.3% | 25 | 37.5 |
| 514 | Greenville, SC | 75,310 | +5.9% | 30 | 34.7 |
| 515 | Apple Valley, CA | 75,247 | -0.7% | 77 | 36.5 |
| 516 | Lake Elsinore, CA | 75,067 | +6.9% | 38 | 33.7 |
| 517 | Wilmington, DE | 73,512 | +3.7% | 11 | 37.0 |
| 518 | Portland, ME | 69,911 | +2.2% | 22 | 37.8 |
| 519 | Cheyenne, WY | 66,507 | +1.7% | 37 | 38.9 |
| 520 | Bentonville, AR | 63,057 | +16.3% | 36 | 32.5 |
| 521 | Bozeman, MT | 58,814 | +9.7% | 21 | 28.9 |
| 522 | Sarasota, FL | 58,458 | +6.6% | 15 | 48.2 |
| 523 | Coeur d'Alene, ID | 58,179 | +6.5% | 17 | 40.1 |
| 524 | Charleston, WV | 46,117 | -5.5% | 31 | 43.0 |
| 525 | Charlottesville, VA | 44,388 | -4.6% | 10 | 33.1 |
| 526 | Burlington, VT | 44,019 | -1.6% | 10 | 26.8 |
| 527 | Annapolis, MD | 40,634 | -0.4% | 7 | 43.0 |
| 528 | Ithaca, NY | 33,632 | +4.8% | 5 | 23.3 |
How this ranking works
Data checked October 18, 2026. The table includes all 546 places we cover: every US city of 75,000+ people, plus popular smaller cities and large suburbs. Click any city for its full profile, or compare two cities side by side. Sources and methods are on how we get our numbers.